Using Data Science for Improving the Use of Scholarly Research in Public Policy

Basil Mahfouz
Scientists worldwide published over 2.6 million papers in 2022 – Almost 5 papers per minute and more than double what they published in the year 2000. Are policy makers making the most of the wealth of available scientific knowledge? In this blog, we describe how we are applying data science methods on the bibliometric database of Elsevier’s International Centre for the Study of Research (ICSR) to analyse how scholarly research is being used by policy makers. More specifically, we will discuss how we are applying natural language processing and network dynamics to identify where there is policy action and also strong evidence; where there is policy interest but a lack of evidence; and where potential policies and strategies are not making full use of available knowledge or tools.
Mapping Research Supply and Demand
On Overton we are able to identify policy documents on specific subjects and then extract metadata on those policies as well as the scholarly papers they cite. Our next step is to compare the research demand—what the policy makers cited—with the supply — what the researchers published.
Every publication in the ICSR database is classified into a range of categories, from 174 broad academic fields down to 96,000 specific topics. For each topic, we know the number of papers that were cited in a set of policy documents. By mapping the frequency of topics across both research demand and supply, we are able to identify topics with higher ratios of papers cited than the average citation ratio across all topics.
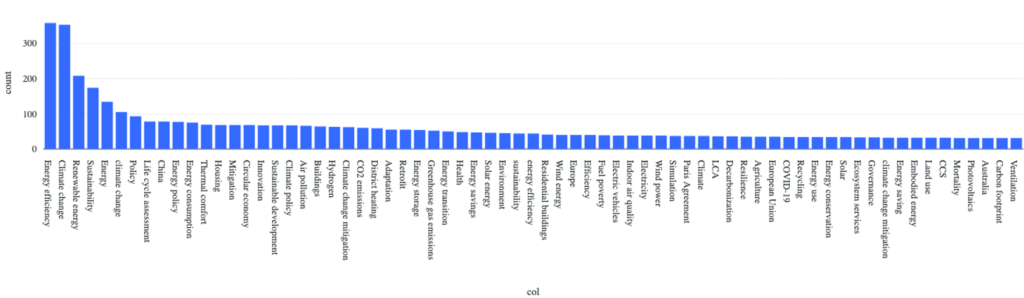
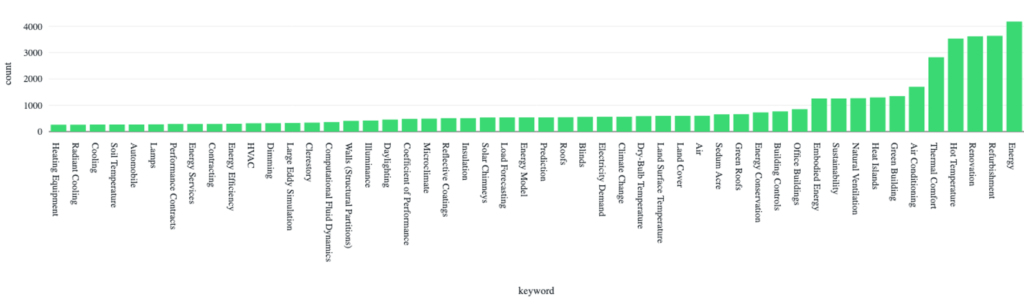
For example, we calculated the demand-supply mismatch across scholarly papers cited in IPCC reports and found a relative undersupply in topics such as “Carbon Dioxide”, “Ocean Circulation”, and “Atmospheric Transport” and an oversupply in topics such as “Wind Power”, “Arbitrage”, and “Electricity Storage”. Within each of these topics, we can further zoom in to understand the differences between cited literature and uncited literature using text analysis. Conventionally research publications include an abstract, a short summary of the paper usually around 200 words long, as well as author indexed keywords, which are terms that the authors, or journal editors, choose to describe their papers. For example, zooming in on the topic of zero-energy buildings, figure 1 shows the frequency of indexed keywords in cited papers (blue) and uncited papers (green), which can be used to show the sub-topics policy makers are particularly interested in.
Fig 1. Keywords of papers cited by policies on zero-energy buildings (blue) vs keywords of papers published on zero-energy buildings (green)
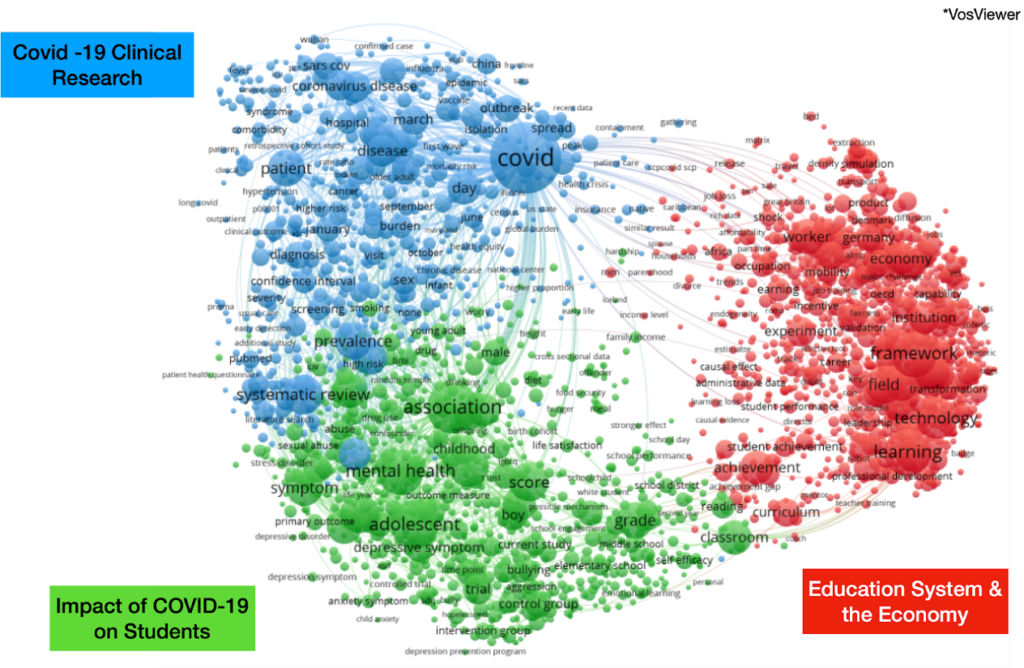
We can zoom in further by using natural language processing (NLP), to identify key topics and thematic clusters. Instead of simply counting the number of times certain keywords appear, we can also start to explore the relationship between different terms within a corpus based on how many times two words appear together in the abstract of research papers. To demonstrate, Fig 2 below shows a network map highlighting main keywords frequently appearing together in the abstracts of papers cited in Education Policies during COVID-19. We can see three clear clusters of co-occurring keywords in the papers of the cited abstracts, one (blue) related COVID-19 clinical research, another (green) related to evidence on the impact of COVID-19 on students, and third (red) on various macro-topics related to education and the economy.
Fig 2: Term Co-Occurrence Map for Cited Research in COVID Education Policy Documents using VosViewer
Assessing How Well Policymakers are Using the “Best” Available Research
Beyond text analysis thanks to the advancement of large pretrained language models, we can now conduct more complex semantic analysis on the abstracts of cited papers. Unlike text-based searches which look for specific keywords, a semantic search can match sentences and paragraphs based on their meanings.
We apply this technique on abstracts, so that for each cited paper, we identify the ‘near misses’ – ie. papers that are highly similar, published within the same date range, but not cited in policy. For example, we extracted over 40,000 citations from 41 reports published by the Intergovernmental Panel on Climate Change (IPCC) and then tracked the bibliometric details of each paper on ICSR Lab. When we performed the semantic search, we matched over half of the cited papers with over 74,000 highly similar papers, ‘near misses’.
By comparing ‘near misses’ with cited research, we can evaluate with high precision what determines if a paper is cited in policy or not. To achieve this, we trained a machine learning model and performed a linear logit and non linear SVR regression using various bibliometric indicators related to quality, such as field weighted citation index, the CiteScore of the publishing journal, the average h-index of the co-authors, and other altmetrics and found a weak relationship between these various indicators, and the probability of being cited.
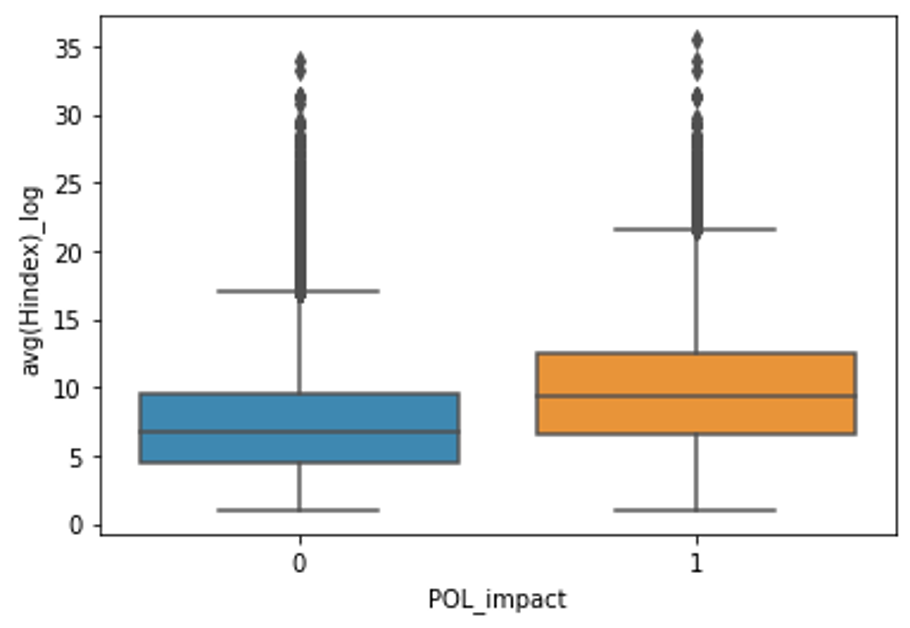
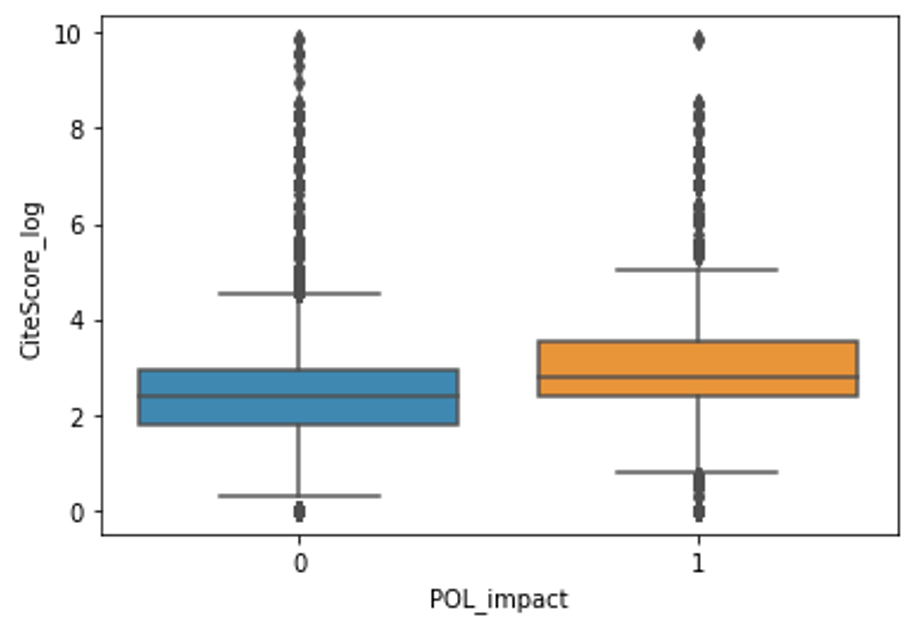
Figure 3 – differences in average h-index of authors (left) and journal citeScore (right) between IPCC cited papers (orange) and their near misses (blue)
Furthermore by running the same algorithm on multiple entities, across domains, we can benchmark the abilities of different policy makers. For example, when comparing IPCC near misses with those from Education policies during COVID-19, we found that quality indicators were between 20 and 30 times more likely to explain the variation between cited and uncited near misses.
Moving Forward: Mapping the Complexity of Innovation
In the next phase of this research we are going beyond analysing the explicit knowledge contained in the publications, towards using publications as indicators of their authors’ tacit knowledge— a measure of their underlying skills and capabilities. Following a 4 month visit to the Harvard Growth Lab, we are applying complexity theory to create a network graph for understanding the geographical patterns of research dynamics.
Moving away from the linear model of innovation, the new approach goes beyond counting the number of publications cited per topic per country, instead reimagining a country’s scientific innovation capability as a complex system that is assembled from a country’s research capabilities. Countries can assemble innovations for which they possess all the necessary research capabilities, akin to constructing an integrated system when all essential components are available.
Using the concept of Relative Comparative Advantage (RCA), we can identify which countries have relative advantages in certain topics. Using this information, for each country we can construct a network comprising the research topics they specialise in. The size of the node represents the degree of specialisation of the country in that topic, while the edges show the proximity between fields, which are derived from cross-field citations.
Using this framework, we are able to go beyond measuring which countries are more influential in shaping global climate policies in specific topics, toward assessing which countries have the most developed capabilities for research on a specific topic based on their research ecosystem. For example, we can determine, for each topic, whether policymakers are drawing upon evidence from the countries with the best capabilities in a certain and adjacent fields, or whether they may be overlooking some research powerhouses.
We are also developing methods for identifying which countries have locked capabilities or potential ‘sparks of innovation’ in certain topics. We determine this by looking at countries that have developed research capabilities in topics that are adjacent, or close, to highly demanded topics in the IPCC reports. We can then develop specific strategies for advising these countries on how to best unlock these sparks of innovation by directing resources more effectively into high priority research fields or identifying countries that they can partner with that have complementary capabilities.
If you are interested in re-publishing our work on other platforms, or sharing our work, please email us.